Farei visualização de dados usando tableau e powerbi

W
wyckliff
W
wyckliff
Dr. W. Herberts
Algumas informações foram traduzidas automaticamente.

Sobre este Serviço

Tradução automática

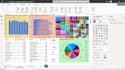
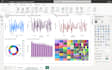
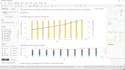
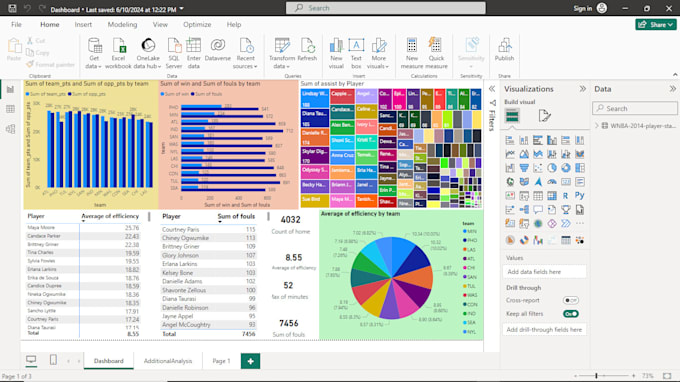
Visualização de dados usando Tableau e Power BI, para exibir planilhas, histórias e dashboards. Os visuais incluem gráficos de linha, gráficos de barras, histogramas, mapas, diagramas de árvore, gráficos de pizza e muitos outros disponíveis no Tableau e Power BI

Conheça mais sobre Dr. W. Herberts

Dr. W. Herberts

Engineering design, FEA, CFD using SolidWorks, ANSYS, Inventor Pro

4,3(1)
  • A partir deQuênia
  • Membro desdeabr. de 2020
  • Responde em aprox.:1 hora
  • Última entrega1 mês
  • Idiomas

    Inglês
I am an Industrial engineer with design skills in Inventor Pro, SolidWorks, and ANSYS Workbench. I can perform conceptual design and FEA & CFD tasks and complete them efficiently. I have 7 years' technical experience in engineering research and design. Also, I can use a wide range of statistical tools to conduct data analysis. The software I can use include SPSS, EViews, JASP, JMP, STATA, Power BI, Ms Excel, and Tableau. I can handle project scheduling and resource allocation tasks: Gantt, WBS, Critical Path using MS Project, Project Libre, and flow charts using Ms Visio and Draw.io

Tradução automática

Meu portfólio