Ver categorias
Explorar
Fiverr Pro
Português
$
USD
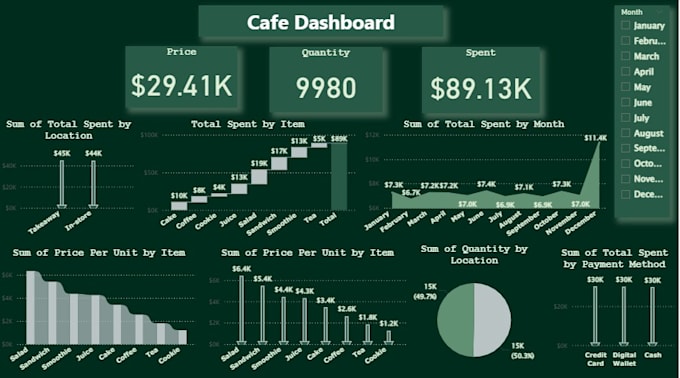
Analista de informações
Desbloqueie todo o potencial dos seus dados com transformação e análise especializada usando Python, Excel, SQL e ferramentas de BI.
Se você precisa de dados limpos, análises aprofundadas ou um dashboard visualmente atraente, eu personalizo soluções para atingir seus objetivos.

_zhupq7.jpg)
Tradução automática
O que preciso fornecer antes de começar?
Por favor, compartilhe seu conjunto de dados (CSV, Excel ou Google Sheet), uma breve descrição do que você precisa (limpeza, análise, visualizações) e quaisquer perguntas específicas que gostaria que fossem respondidas.
Quais ferramentas você usa?
Eu uso Python (Pandas, NumPy, Matplotlib), Excel, SQL, Power BI e Jupyter Notebooks para análise, visualização e relatórios.
Você pode trabalhar com grandes conjuntos de dados?
Sim! Para conjuntos de dados grandes ou complexos, envie uma mensagem primeiro para que eu possa personalizar um orçamento e o prazo de entrega.
Receberei os arquivos de origem?
Com certeza! Fornecerei todos os arquivos relevantes — dados limpos, visualizações, notebooks de código ou dashboards — dependendo do seu pacote.
Você pode explicar os resultados para mim se eu não tiver um background técnico?
Sim, ofereço explicações claras e acessíveis para iniciantes, para que você compreenda totalmente seus dados e insights.