Ver categorias
Português
$
USD
Conecte-se à sua IA


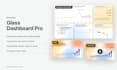


Turn your raw data into clear insights, beautiful charts and dashboards you and your team will actually use.
Send me your Excel, CSV or Google Sheets file and tell me what you want to know. I clean and analyze your data, find the key trends and deliver a professional result with a short, easy-to-read summary.
WHAT YOU GET
Basic - Insight report (PDF) with charts, tables and key takeaways
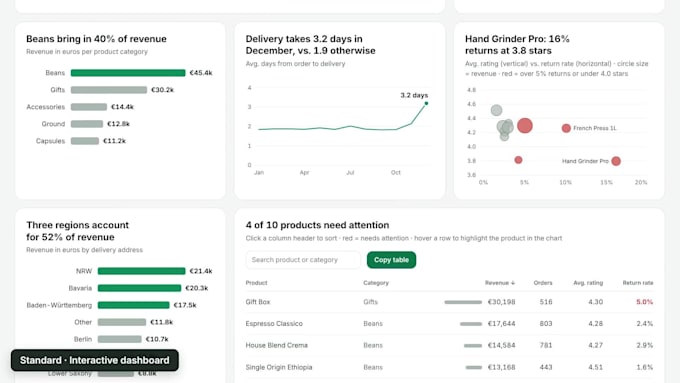
Standard - Interactive dashboard with filters, KPI tiles and hover details
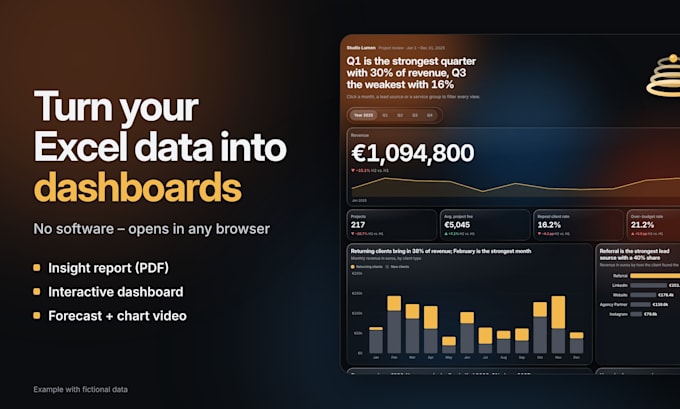
Premium - Glass-style dashboard with 3D elements, forecast, presentation slides and an animated chart video (landscape 16:9 or vertical 9:16 for Reels & TikTok)
WHY WORK WITH ME
Clean, modern design - no cluttered spreadsheet look
Insights in plain language, not just numbers
A design made for your business - your colours and style not a copy of just another template
Your data stays confidential and is deleted after delivery
EXTRAS
Deep research & market benchmarks, data cleaning, forecasting, presentation slides, chart video, branding, social media graphics, bilingual version (EN/DE), express delivery and monthly updates.
Not sure which package fits? Message me before ordering - I'll check your data for free.
Data Analysis and Infographics
Idiomas
Which file formats do you accept?
Excel (.xlsx, .xls), CSV and Google Sheets links. For other formats (JSON, SQL exports, PDFs with tables), message me first.
How much data can you handle?
From a few hundred to several hundred thousand rows. If your file is very large or spread over many files, message me before ordering so I can check it.
Which package should I choose?
Basic for a quick written overview. Standard if you or your team want to explore the data yourselves. Premium if you need to present the results - it includes a forecast, slides and an animated chart video.
How do I receive the dashboard?
As an interactive HTML file that opens in any browser - no software, login or subscription needed. You can share it with your team or embed it on your website.
Is my data safe?
Yes. Your data is only used for your order and is deleted after delivery (or after our collaboration ends if you book monthly updates). Please remove personal data such as names or emails before sending.
What do I need for a forecast?
At least 12 months of data, ideally more. Forecasts are estimates and are always shown with an uncertainty range. If your data is not sufficient, I'll tell you before starting.
Can the chart video be vertical?
Yes. Choose landscape 16:9 for presentations or vertical 9:16 for Reels, TikTok and LinkedIn. Need both formats? Just message me.
Can you use my brand colors and logo?
Yes. Upload your logo and colors when ordering and message me - I'll send you a small custom offer for full branding across all deliverables.
Do you offer ongoing updates?
Yes. After a Standard or Premium order, I can update your dashboard every month with new data in the same format. Message me for a custom offer.