Ver categorias
Explorar
Fiverr Pro
Português
$
USD

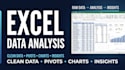
Have data in Excel but need help turning it into useful information?
I can clean, analyze, summarize, and visualize your data using Excel's built-in analytical tools and functions.
Depending on your dataset and requirements, I can help with:
I can work with sales, marketing, customer, survey, inventory, financial, operational, and other structured datasets.
My focus is not just on calculating numbers. I will organize the analysis so that the important patterns, trends, and findings are easy to understand.
If you already know what you want to analyze, send me your requirements and dataset. If you're unsure which Excel method or analysis is appropriate, feel free to message me before ordering.
Please provide a sample of your data and explain what you want to learn from it so I can confirm the scope before you place an order.
I turn raw survey and business data into statistically sound insights
Idiomas
What types of Excel data can you analyze?
I can work with sales, marketing, customer, survey, inventory, financial, operational, and other structured datasets. You can send me a sample of your data if you're unsure whether your project is suitable.
Can you clean and organize my Excel data?
Yes. I can help with duplicates, missing or inconsistent entries, formatting issues, data organization, and other common data-cleaning tasks.
Can you create PivotTables and charts?
Yes. I can create PivotTables, PivotCharts, and other appropriate visualizations to summarize and present your data clearly.
Can you use Excel's Data Analysis ToolPak?
Yes. Depending on your requirements, I can use appropriate tools from Excel's Data Analysis ToolPak for statistical analysis.
Can you perform regression or correlation analysis in Excel?
Yes. I can perform appropriate regression, correlation, descriptive statistical, and other analyses when they are suitable for your dataset and objectives.
Can you use Solver?
Yes. I can use Excel Solver for suitable optimization and what-if analysis problems when the dataset and requirements support it.
Can you create an Excel dashboard?
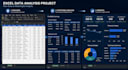
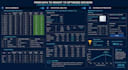
I can create a structured Excel reporting/dashboard-style worksheet using PivotTables, charts, KPI summaries, formulas, and other Excel features. The exact design depends on your dataset and requirements.
Can you automate my Excel report?
I can improve the efficiency of recurring reports using Excel formulas, PivotTables, and other built-in Excel features. For advanced VBA or automation requirements, please contact me before ordering so I can confirm the scope.
Will I receive an editable Excel file?
Yes. The completed analysis will generally be provided as an editable Excel workbook, depending on the requirements of the project.
Can you explain the findings from my data?
Yes. I can provide a clear summary of important trends, patterns, relationships, and findings identified during the analysis.


