Ver categorias
Explorar
Fiverr Pro
Português
$
USD

Power BI and Excel Dashboard Specialist, Business Intelligence, Data Analytics
Habilidades
Conheça meus serviços
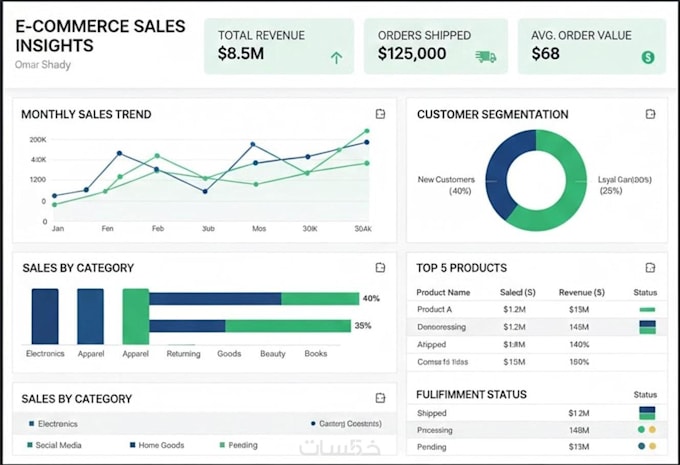
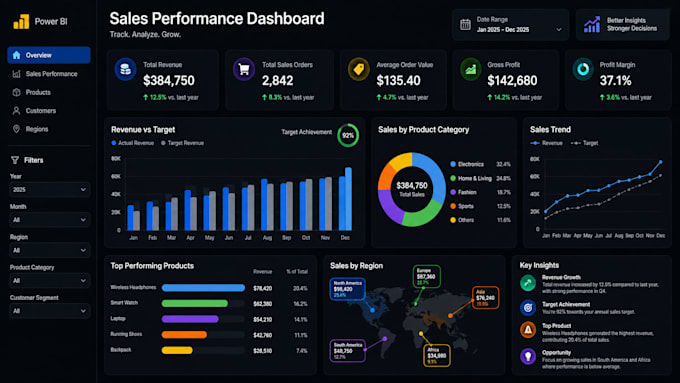

Power BI Dashboard Developer
Freelance
Oct 2025 - Present • 1 yr
Designed and developed interactive Power BI dashboards to help clients monitor business performance and make data driven decisions. Worked on sales reporting, KPI monitoring, financial performance analysis, and business intelligence projects. Prepared and organized datasets, developed visual reports, created KPI cards, and built interactive charts to communicate important trends clearly. Collaborated with clients to understand their reporting requirements, identify relevant performance metrics, and deliver dashboards tailored to their business objectives. Focused on data accuracy, intuitive layouts, consistent metric definitions, and practical insights that help users identify performance gaps and track progress

Microsoft Excel Data Analyst
Freelancing Career
May 2025 - Present • 1 yr 5 mos
Helped clients improve the quality and usability of spreadsheet data through data cleaning, formula correction, structured reporting, and dashboard development. Worked with datasets requiring consistent formatting, duplicate checks, missing-value reviews, and better organization for analysis. Created Excel reports using formulas, pivot tables, charts, and summary tables to make business information easier to review. Focused on reducing repetitive manual work, improving the clarity of reports, and ensuring calculations aligned with the client's requirements. Communicated with clients to understand their spreadsheet challenges and deliver organized workbooks suited to their reporting needs
Business Intelligence and Reporting Analyst
Freelance
Oct 2024 - Present • 2 yrs
Supported business reporting projects by transforming raw operational data into structured reports and visual dashboards. Worked on performance tracking, sales analysis, financial reporting, and KPI monitoring to help clients understand business trends and evaluate results against their objectives. Reviewed data structures, organized key metrics, and developed clear visualizations that made important information easier to interpret. Designed reports with a focus on usability, consistency, and relevance to business goals, helping users compare reporting periods and identify areas that may require attention. Prioritized understanding each project's requirements, maintaining clear communication, and delivering practical reporting solutions that support informed decision making
