Please message me before placing an order to avoid any inconvenience.
Hello,
I am Omer with more than 6 years of experience in developing python solutions, majorly in Machine Learning, Data Science and Artificial Intelligence.
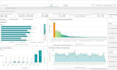
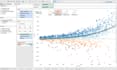
SERVICE: I will do data visualization (create plots/charts/graphs) from your data.
HOW IT WORKS?
- You provide me data in any format (csv, excel, sql, json, xml etc ).
- I will visualize your data.
TYPES OF PLOTS
- Scatterplot
- Histogram
- Box and Whiskers Plot
- Heatmaps
- Time Plot
- Bar Plot
- Pie Charts
- Bubble Plot
- Area Graph
- Bubble Map
- Candlestick Chart
- Choropleth Map
- Density Plot
- Gantt Chart
- Violin Plot
- Word Cloud
- etc
TOOLS I USE
- Python
- Pandas, Numpy (for handling datasets)
- Matplotlib, Seaborn (for static data visualization)
- Bokeh, Plotly (for interactive data visualization)
- Plotly-dash (for dashboard development)
- Tableau (for interactive visualizations and dashboard development)
- Enviroment: Jupyter notebooks, Pycharm
WHY CHOOSE ME?
- Certified Data Science Professional with expertise in Data Visualization and Data Analysis
- Guaranteed On-time delivery
NOTE: Upon demand I also provide analysis and report writing on your data. (Please refer to gig extra)