Ver categorias
Explorar
Fiverr Pro
Português
$
USD


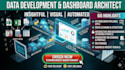
Raw data is useless without proper processing and visualization. Whether you need to clean a messy dataset, automate an ETL (Extract, Transform, Load) pipeline, or visualize metrics for decision-making, I provide end-to-end data engineering solutions.
What I offer:
Why work with me? Data integrity is my priority. I build pipelines that handle edge cases gracefully, ensuring the numbers you see on your dashboard are strictly accurate.
Please contact me to discuss your data structure and goals before ordering.
Data Developer
Idiomas
Q: Is my data kept confidential?
A: Absolutely. I adhere to strict professional standards. For highly sensitive data, I recommend providing an anonymized sample dataset for the development phase.
Q: Can you connect the dashboard to a live API?
A: Yes, the Standard and Premium packages can include fetching real-time data from external APIs before visualizing it.
Q: What format will the final dashboard be?
A: Typically, I deliver a containerized web application (e.g., a Python Streamlit app) that you can easily run locally or deploy to a server to share with your team.
