Ver categorias
Explorar
Fiverr Pro
Português
$
USD


Tradução automática
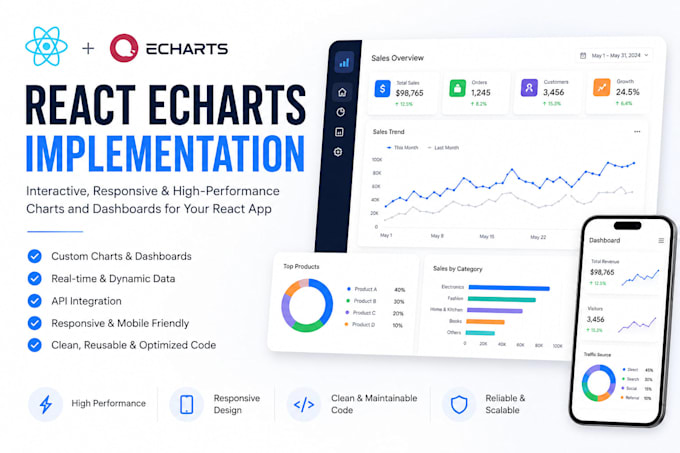
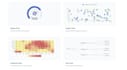
Vou criar visualizações de dados interativas e dashboards de alta qualidade usando React e Apache ECharts. Seja para gráficos simples ou dashboards complexos em tempo real, entregarei soluções limpas, responsivas e de alto desempenho, personalizadas para sua aplicação.
O que posso construir:
Isso é ideal para plataformas de análise, dashboards de administração, produtos SaaS e ferramentas de relatório.
Gráfico Único Básico
Dashboard Padrão com Múltiplos Gráficos
Dashboard Avançado Premium
Experienced Software Engineer
Idiomas
Tradução automática
Tradução automática
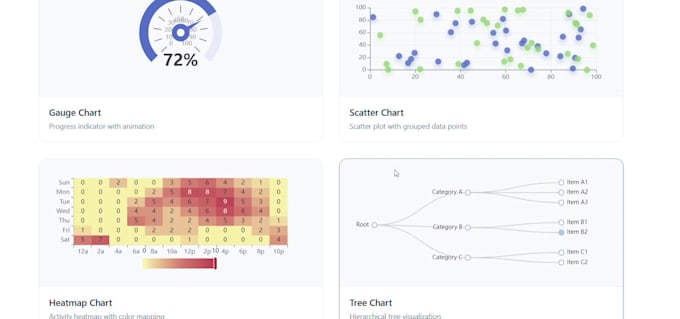
Que tipo de gráficos você pode construir?
Posso construir uma ampla variedade de gráficos, incluindo linha, barra, pizza, área, dispersão, heatmaps e visualizações avançadas usando ECharts/ D3 Js.
Você pode integrar gráficos no meu app React existente?
Sim. Posso integrar gráficos de forma fluida no seu projeto React atual, seguindo sua estrutura de código e sistema de design.
Você suporta dados em tempo real ou dinâmicos?
Sim. Posso conectar gráficos a APIs ou fontes de dados ao vivo e atualizá-los dinamicamente na sua aplicação React.
Preciso fornecer dados?
Sim. Você pode fornecer endpoints de API, dados JSON de exemplo ou arquivos de dataset. Se necessário, também posso criar dados fictícios para desenvolvimento.
Os gráficos serão responsivos?
Sim. Todos os gráficos serão otimizados para diferentes tamanhos de tela, incluindo desktop, tablet e mobile.
Você pode criar um dashboard completo com múltiplos gráficos?
Sim. Posso construir dashboards completos com vários gráficos, filtros e componentes interativos.