Ver categorias
Explorar
Fiverr Pro
Português
$
USD

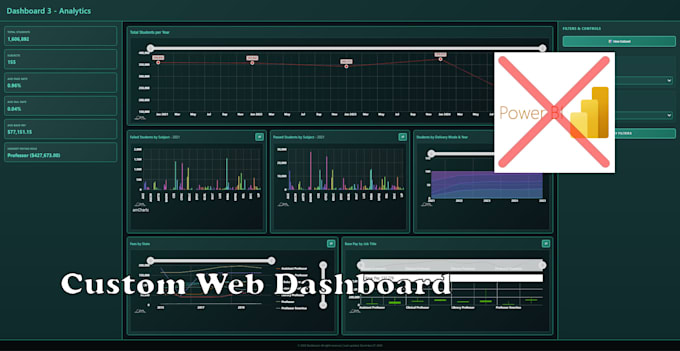
You provide your data, and I build a custom interactive HTML dashboard that helps you explore and understand your data clearly.
I create dashboards using pure, hard-coded web development no Power BI, or third-party dashboard tools. This gives you full control, lightweight performance, and a dashboard that works in any modern browser.
Live Interactive Dashboard Demo (Click & Try):
See a working dashboard with charts, filters, and interactions:
What you get:
Layout options:
Basic & Standard:
Premium:
Data & customization:
Delivery:
Not sure which package fits your data?
Send a message and i'll help you.
Data Science AI Undergraduate
Idiomas
Can I send raw or unclean data?
Yes. • Basic package requires clean, ready-to-use data. • Standard and Premium packages include data cleaning, preparation, and structuring before building the dashboard. If you’re unsure whether your data is clean, feel free to message me first.
What data formats do you accept?
I accept CSV and Excel files. If you have multiple datasets, the supported number depends on the package you choose.
Are the dashboards interactive?
Yes. All dashboards include interactive charts and filters that allow you to explore the data easily.
How will the dashboard be delivered?
You’ll receive an HTML file that works in any modern browser. No special software is required
What counts as a revision?
Revisions include small adjustments such as colors, labels, or chart tweaks. Major changes like new data sources or additional charts may require an extra order or gig extra
I’m not sure which package to choose. What should I do?
Send me a message with your data and goals, and I’ll help you choose the most suitable package