Ver categorias
Explorar
Fiverr Pro
Português
$
USD
Turning raw data into powerful insights dashboards
Struggling with messy data or static reports? I can help you turn raw data into smart decisions!
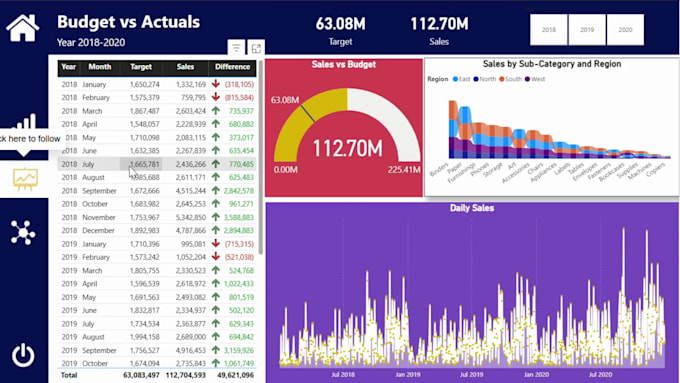
I'm a data analyst specializing in Power BI, Excel, SQL, and Python (Pandas & Matplotlib) delivering dashboards, reports, and insights that are clean, interactive, and business-ready.
What I offer:
Data Cleaning & Transformation (Excel, SQL, Python)
KPI Dashboards in Power BI
Interactive Reports with Filters & Charts
Python data cleaning and visualization using Pandas and Matplotlib.
Dataset/Model Review & Audit
Excel to Power BI migration & integration
Whether you need a basic dashboard, a live report, or a full analytics solution, I ensure clarity, speed, and accuracy.
Message me before placing an order so we can tailor the best solution for your data.



What tools do you use for data analysis and dashboards?
I use Power BI, Excel, SQL, and Python (Pandas, Matplotlib) to clean, analyze, and visualize your data. Depending on your needs, I’ll choose the most efficient tool or a combination.
Can I provide raw or messy data?
Absolutely! I specialize in cleaning and transforming raw or unstructured data. Just share your file, and I’ll take care of the rest.
What types of dashboards can you create?
I can build dashboards for sales tracking, financial reporting, rental/property analysis, marketing performance, and more — fully customized to your business needs.