Ver categorias
Explorar
Fiverr Pro
Português
$
USD

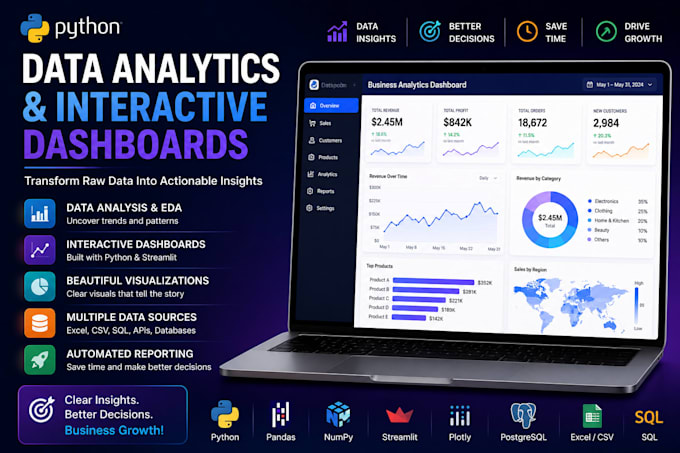
Turn Raw Data Into Business Insights Fast
I help businesses and teams make sense of their data through clean analysis, clear visuals, and interactive dashboards built with Python.
Whether your data lives in Excel, CSV files, SQL databases, or an API, I'll clean it, analyze it, and turn it into a dashboard you can actually use to make decisions not just a static report that sits in a folder.
What you get:
Data cleaning & exploratory analysis (EDA)
Interactive dashboards (Streamlit)
KPI reports & business analytics
Automated reporting workflows
SQL-based analysis for larger datasets
Machine learning insights (trend detection, forecasting, segmentation) on higher tiers
Tools I work with:
Python · Pandas · NumPy · Plotly · Streamlit · SQL · PostgreSQL · Matplotlib · Scikit-learn
Why work with me:
I don't just hand you charts I build dashboards designed around the decisions you're actually trying to make, so the output is something your team will keep using, not a one-time file.
Send me your data and a quick note on what questions you're trying to answer, and I'll recommend the right package for your needs.
AI Lead Automation Specialist CRM, Chatbots, Booking Sales Workflows
Idiomas