Ver categorias
Explorar
Fiverr Pro
Português
$
USD




Turn your raw data into clear, actionable insights.
Spreadsheets don't make decisions. People do. But people need to see the trends first.
I am a Statistics student at Dokuz Eylül University, and I don't just blindly plot numbersI find the actual story behind them. Having built analytical backends and predictive logic for a cafe management startup, I know exactly what business owners, founders, and researchers need to see to make fast decisions.
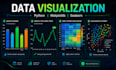
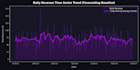
Using Python (Matplotlib & Seaborn), I will transform your complex datasets into clean, presentation-ready visual reports.
WHAT I CAN CREATE FOR YOU:
WHY WORK WITH ME? I combine a strong academic foundation in statistics with hands-on coding experience. I make sure your graphs are not just colorful, but statistically accurate and easy to read.
Please message me before placing an order so we can discuss exactly what insights you want to extract from your data!
Python Data Specialist
Idiomas
What file formats do you accept?
I accept CSV, Excel (.xlsx, .xls), and JSON files. If you have another format, please message me first!
Can you match the charts with my company's brand colors?
Yes, absolutely. Just provide me with your brand's color codes (HEX or RGB) or logo, and I will customize the Matplotlib/Seaborn visuals to match your corporate identity perfectly.
What happens if my data has missing values or is extremely messy?
For minor issues, I can handle basic formatting. However, if your data requires deep cleaning and statistical imputation, I offer a separate "Data Cleaning & Preprocessing" gig. We can combine them into a custom offer.
Do you provide the source code with the graphs?
Yes, in the Standard and Premium packages, I provide the Python script or the Jupyter Notebook file along with the high-resolution images (PNG/PDF).


